


A skateboard was rolled off different sized ramps and down a driveway. These graphs show the distance traveled in feet over the amount of time in seconds. The first graph was a 21 inch ramp, then the second was a 14 inch ramp, and then the last was a 7 inch ramp. First, the class had to predict, in a colored pencil drawing, how the graph would turn out on each ramp. Then, we actually graphed it in actual time and feet with pencil. As you can see, my predictions were a little bit off but got closer in prediction as the ramp got smaller. The domain of the graphs was 0-37 and the range of these graphs was 0-64. All together, the graphs are fairly similar in how they start at zero, reach a maximum and then end by slowing down. They are all similar in the way that they have a faster velocity in the beginning than at the end of the graph. The graphs have a positive velocity before reaching the maximum of 64 feet, 21 inch ramp and 14 inch ramp, and the maximum of 42/43 feet, the 7 inch ramp. Then they have a negative velocity when the skateboard starts to roll slowly back down the driveway.
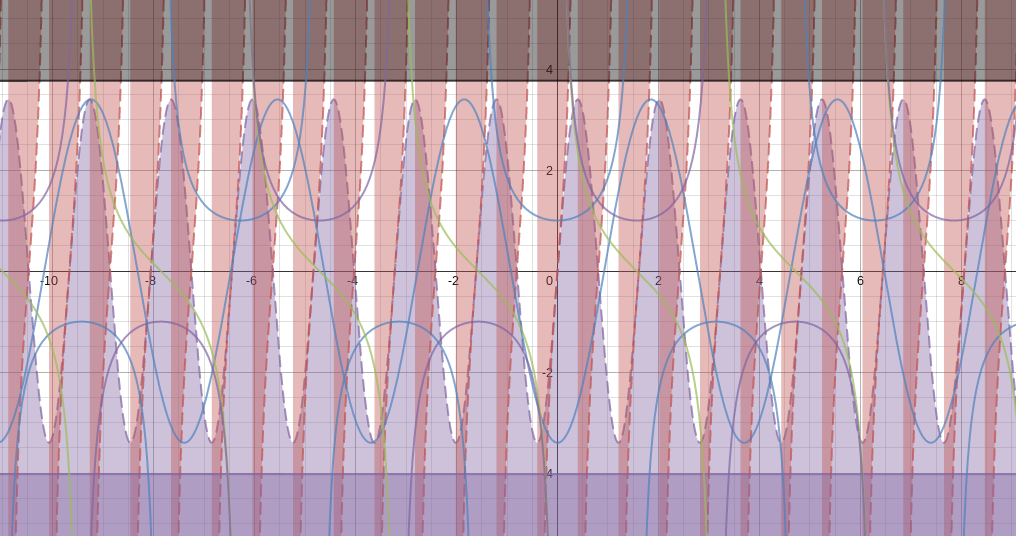 This is my art that i made on desmos.com. Desmos is a math calculator website that allows people to use the calculator for math problems and it also lets you use the graphing functions. Using these graphing functions... I made a piece of art work all with just equations and shading. This was basically all made with horizontal line functions and vertical line functions. I also used sine, cosine, and tangent functions.
|
AuthorThis is my blog. Everything I do basically gets documented here!!! :D Archives
April 2015
Categories |
 RSS Feed
